
Debug official Haiku apps
 DigitalBox
- Dev
- November 16, 2024
We have recently learnt how to compile the official apps from the Haiku sources.
Today, we will review how to compile these apps with debugging information in the executables in order to debug them.
If you don't know how to compile the official apps from sources, I advise you to read the dedicated article on this topic : "Compile official Haiku apps".
Now let's learn how to do the same, but with debugging information.
Setup
In a Terminal, in the "generated.x86_64" folder, launch the below command :
cp ../build/jam/UserBuildConfig.sample ../build/jam/UserBuildConfig
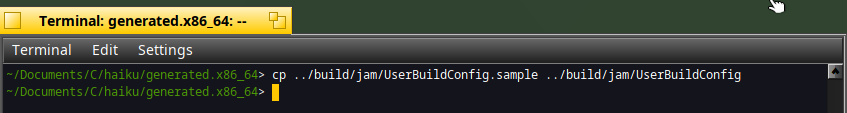
It will copy the jam build config sample into the "UserBuildConfig" which is the recognized filename for jam build setup.
Then edit the file with "Pe" :
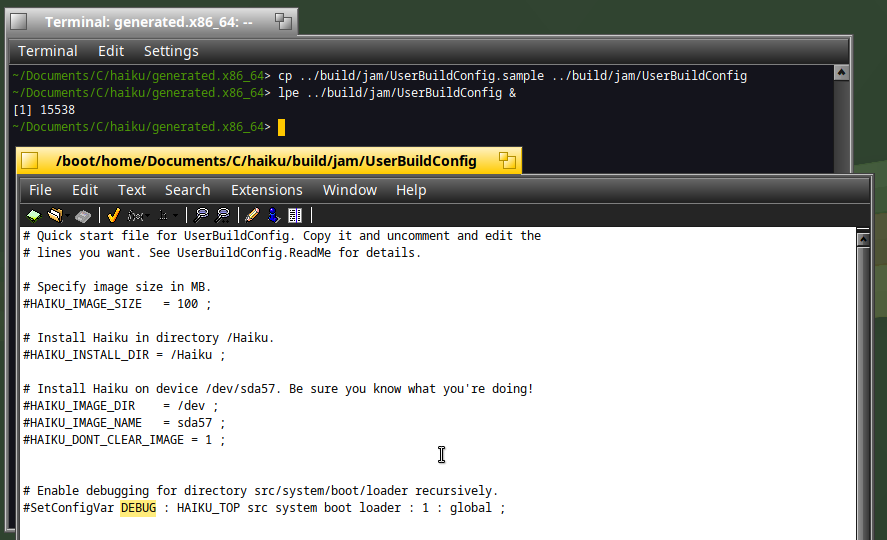
As you can see, there's a line about DEBUG setup.
Replace this line by the below :
SetConfigVar DEBUG : HAIKU_TOP src apps : 1 : global ;

It will indicate to Jam that all the executables in the "src/apps" folder will be generated with debugging information.
Compile
Now compile the "Clock" application :
jam -q Clock
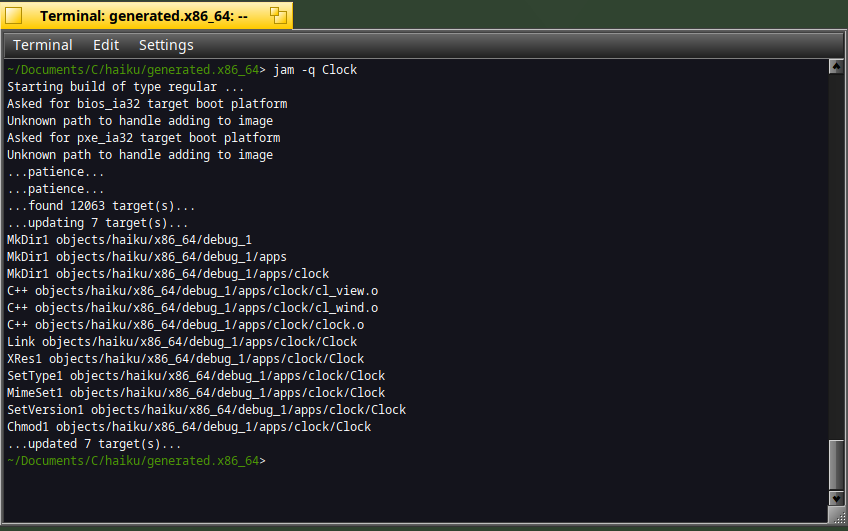
As you can see, the Clock executable is now built in "debug_1/apps" folder (instead of "release/apps" one).
Launch the program :
objects/haiku/x86_64/debug_1/apps/clock/Clock
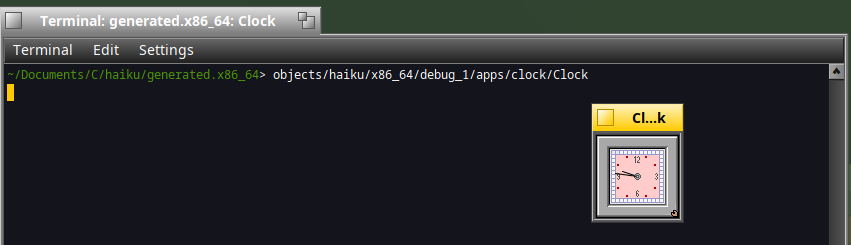
Great it's working fine :)
Debug with Debugger
In a Terminal type the below command to start debugging the Clock app :
Debugger ./objects/haiku/x86_64/debug_1/apps/clock/Clock &
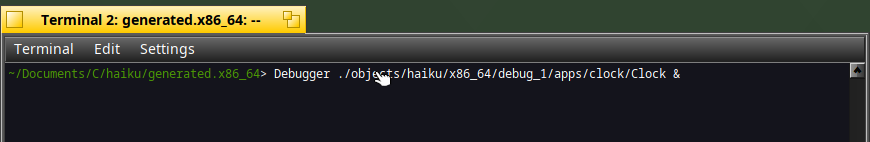
You should see the below main waiting for your feedback :
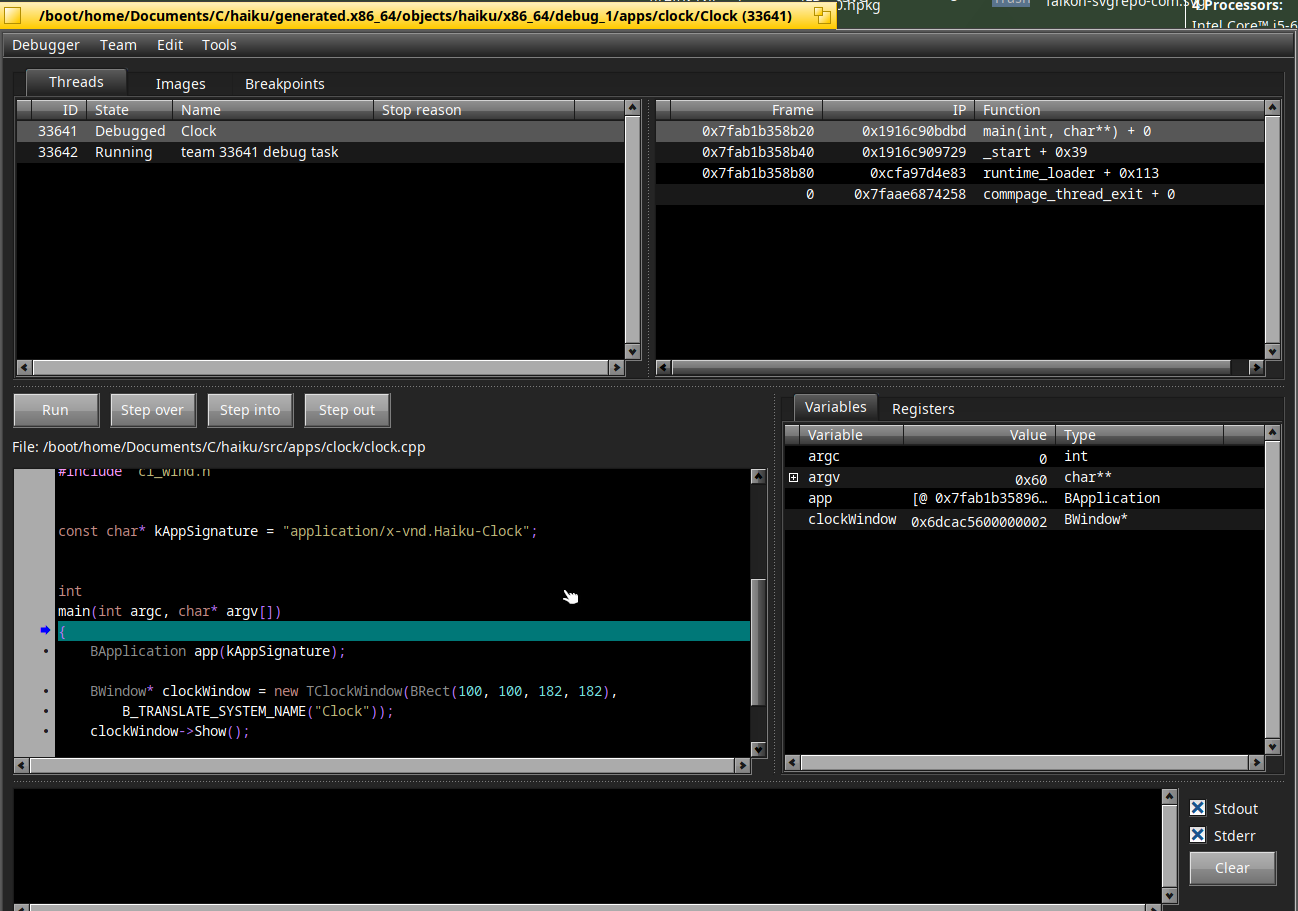
Click on "Run" to continue the program execution.
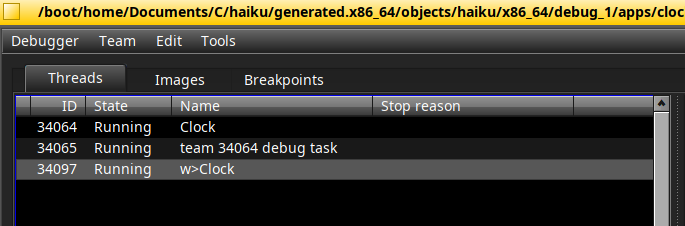
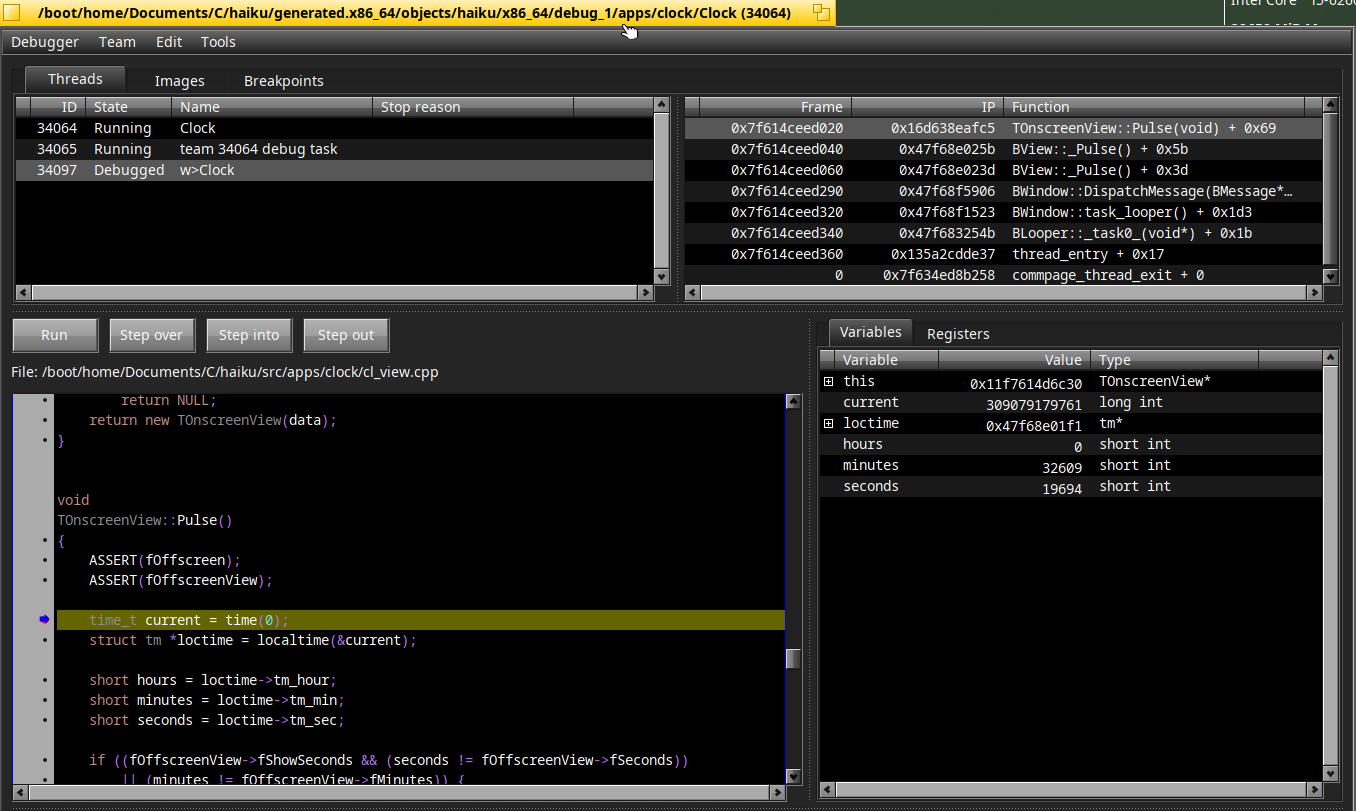
Now go into the thread "w>Clock" representing the window of the clock:
In the File/Function on the right, select the "cl_view.cpp" :
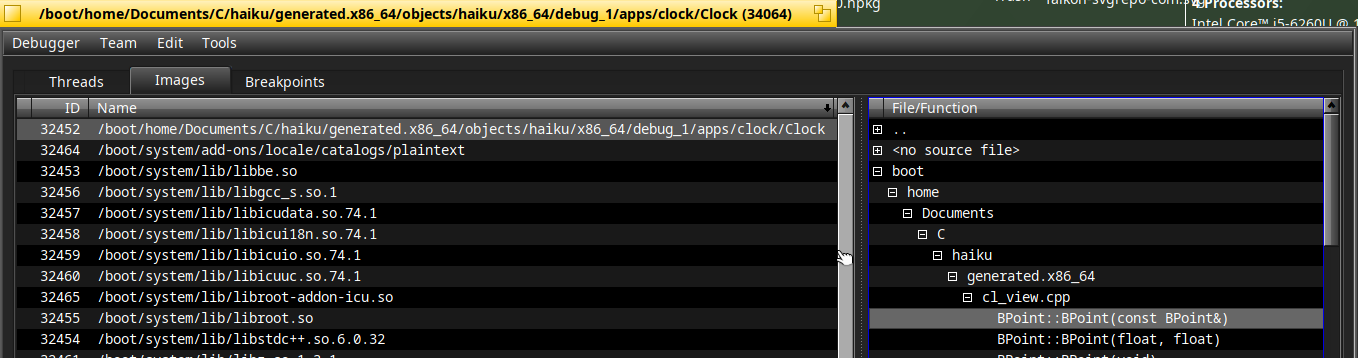
There should be a "Pulse" function as per below :
If you don't see the source code of "cl_view.cpp", you can manually select the file :
Click on the filename and select in the pop-up menu the corresponding source code :

Great !
Now you can put a breakpoint in the Pulse() function by clicking on the left of the line in the source :

The program will stop and will wait for your feedback.
You can remove the breakpoint by clicking on it again and run the program.
Please note that in case of crash of the application, Debug will propose you a "generate report" option.
This is quite helpful for debugging because it gives a text readable backtrace you can upload when creating a ticket on Haiku tracker website.
Debug with GDB
The method used will be the same than the one described in "Debug with GDB".
Launch Qt Creator and select the "Debug>Start Debugging" menu :
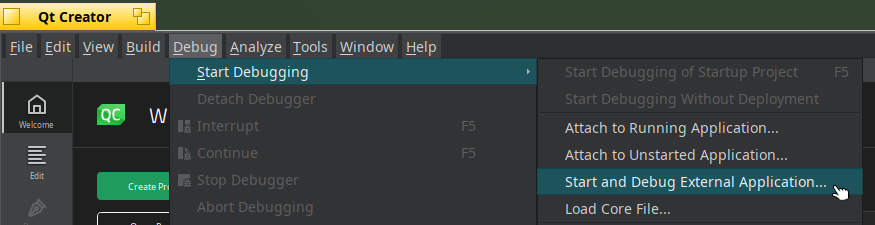
To start a new debugging session, select "Start and Debug External Application".
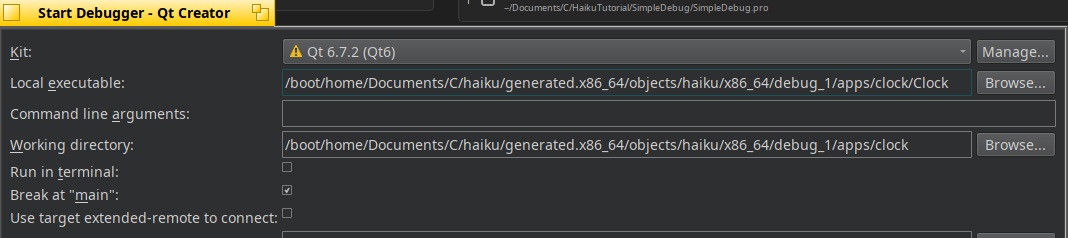
Indicate the name of the executable to debug in "local executable" :
The main program source should be visible as per below waiting for your feedback :
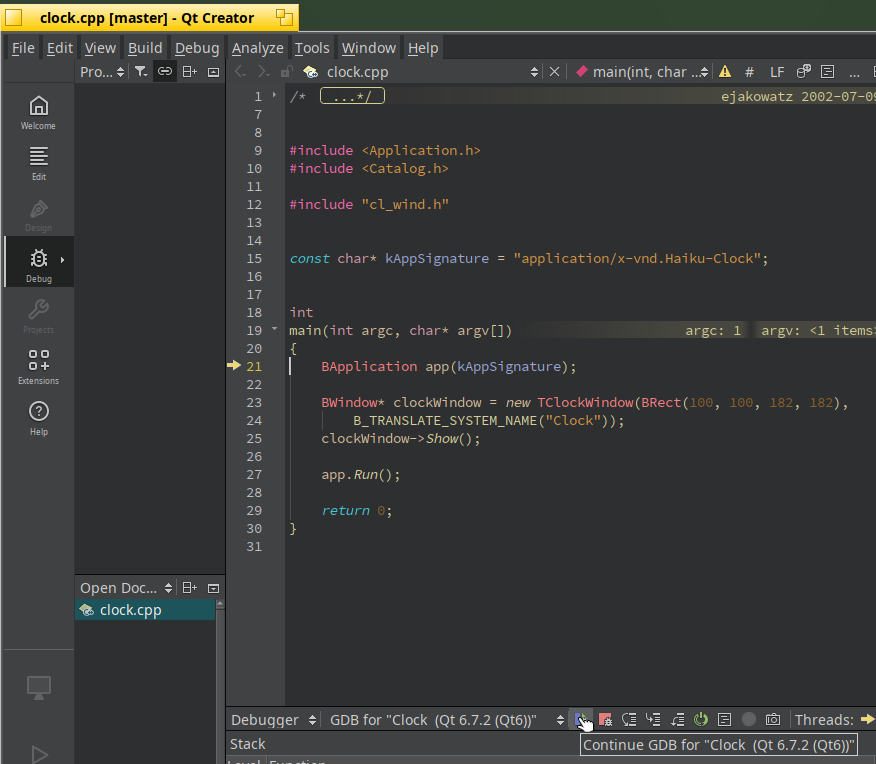
Click on the continue icon ("Continue GDB" as per screenshot).
The program should run fine displaying a window with the hour of the system.
Now open the "cl_view.app" from the "src/apps" directory in Qt Creator and put a breakpoint in the Pulse() method :
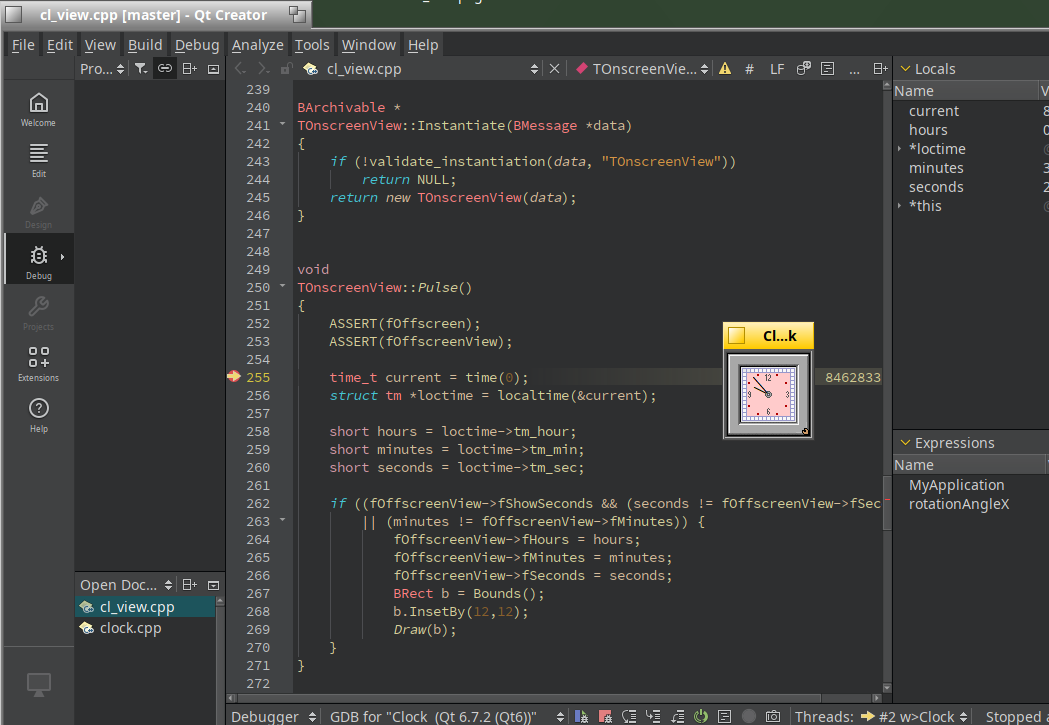
Yeepa !
The Clock application has now stopped and you can continue your debugging session :)
You should now mastering the art of debugging applications under Haiku whatever your preferred choice: GDB or the default Haiku Debugger.