Debug with GDB
 DigitalBox
- Dev
- October 27, 2024
For those who are developping applications for Haiku or porting programs to Haiku, one of the key point is the ability to debug the sources of the program.
Using the built-in Debugger is the first reflex, as it's included by default with the system.
However it has some limitations, and for more robust debugging, you will need to use the GNU Debugger (GDB).
Since 2007, Haiku is participating regularly to the Google Summer of Code (GSoC).
It's an opportunity to work on various system improvements, drivers, tools, and is often use to focus on areas that help the OS to be more complete or efficient.
This year, a student - trungnt2910 - improve the userland debugging experience with great success.
Indeed, a recent version of the GNU Debugger was ported to Haiku this summer, leading to really help the developpers and unlock the current limitation of the Haiku built-in Debugger.
Pre-requisites
If you didn't already, I suggest you to read the article on how to Setup a C++ dev environment.
Indeed, it includes a nice basic OpenGL program (rotating cube), we will use to illustrate how to debug with GDB.
The second point is a tool I really appreciate under Haiku for the development : Qt Creator.
"What is the link between Qt Creator and GDB ?"
You would ask Well, the short answer is : do you really want to debug with GDB only ?
Because it has no GUI available.
That's where Qt Creator will be helpful : it will be used as the GUI to access to the powerful GDB features.
So you need to install Qt Creator via Haiku Depot.
Select the "All packages" tab and then search for "qt creator" :
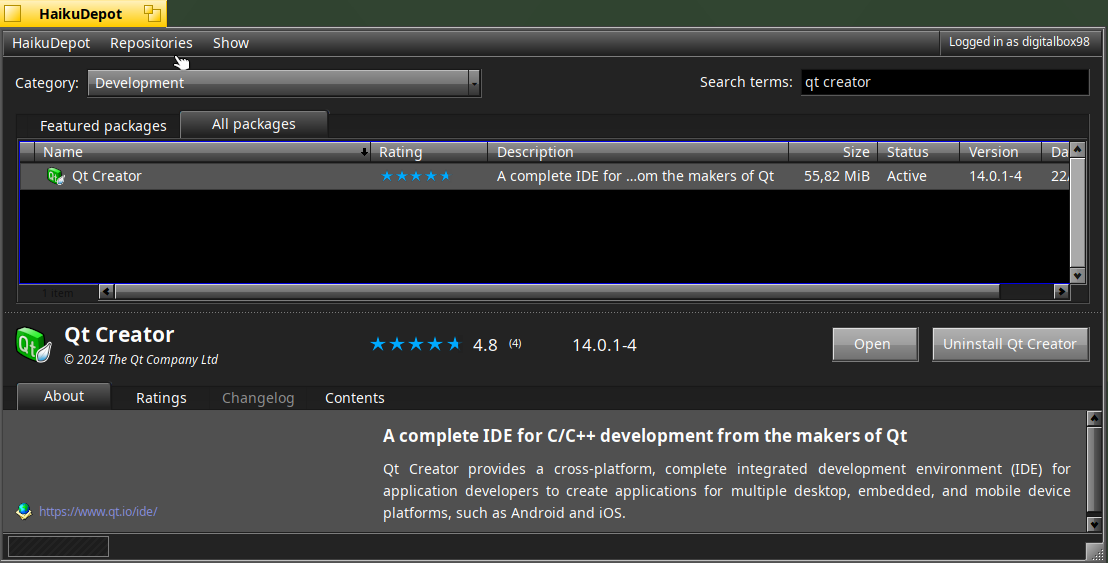
Then click on "Install".
Now that Qt Creator is available on your marchine, let's move to the next step.
Configure
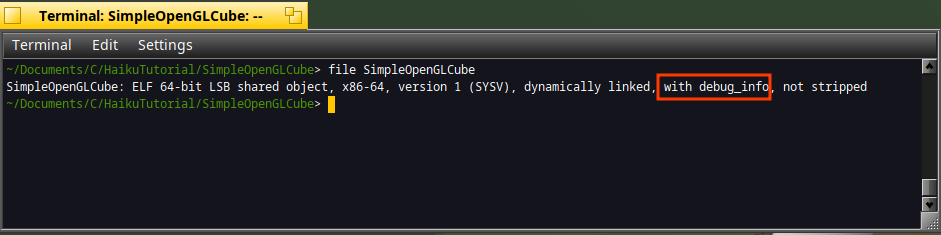
Before configuring Qt Creator for debugging, be sure to have an executable generated with debugging info :
To refresh your memory, last time we debugged the SimpleOpenGLCube with the built-in Debugger :
Now open Qt Creator.
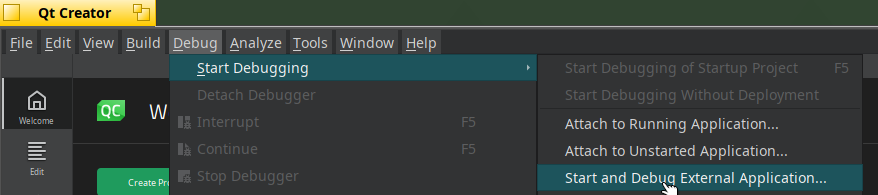
Select the "Debug" menu and "Start Debugging>Start and Debug External Application" :
On the Kit line, select "Manage" :
You need to verify that the "Debugger" is set to GDB as below for your current kit :

Click on "OK".
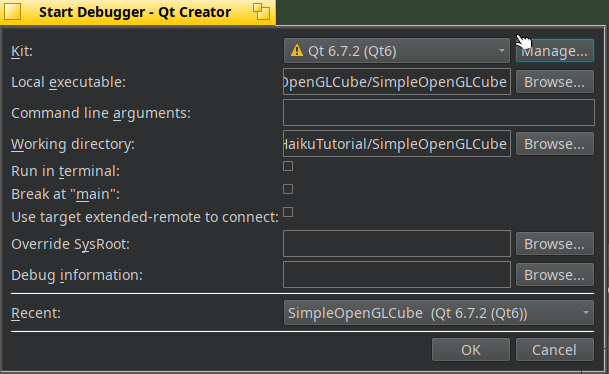
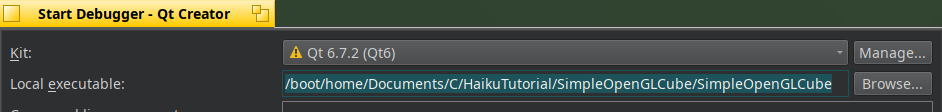
Now in the main setup window, indicate the full path of your application to debug :
You can also indicate the "Working directory" if needed. Finally, click on "Break at main" :

It will put a break when the main function of your application is starting.
Now click "Ok" to validate the start of your debugging session.
Debug
The first time the program to debug is launched, it will take around 15-20 seconds.
So don't be afraid if nothing happens during that time.
As stated before, you should see the program stop at the start of the main() function :
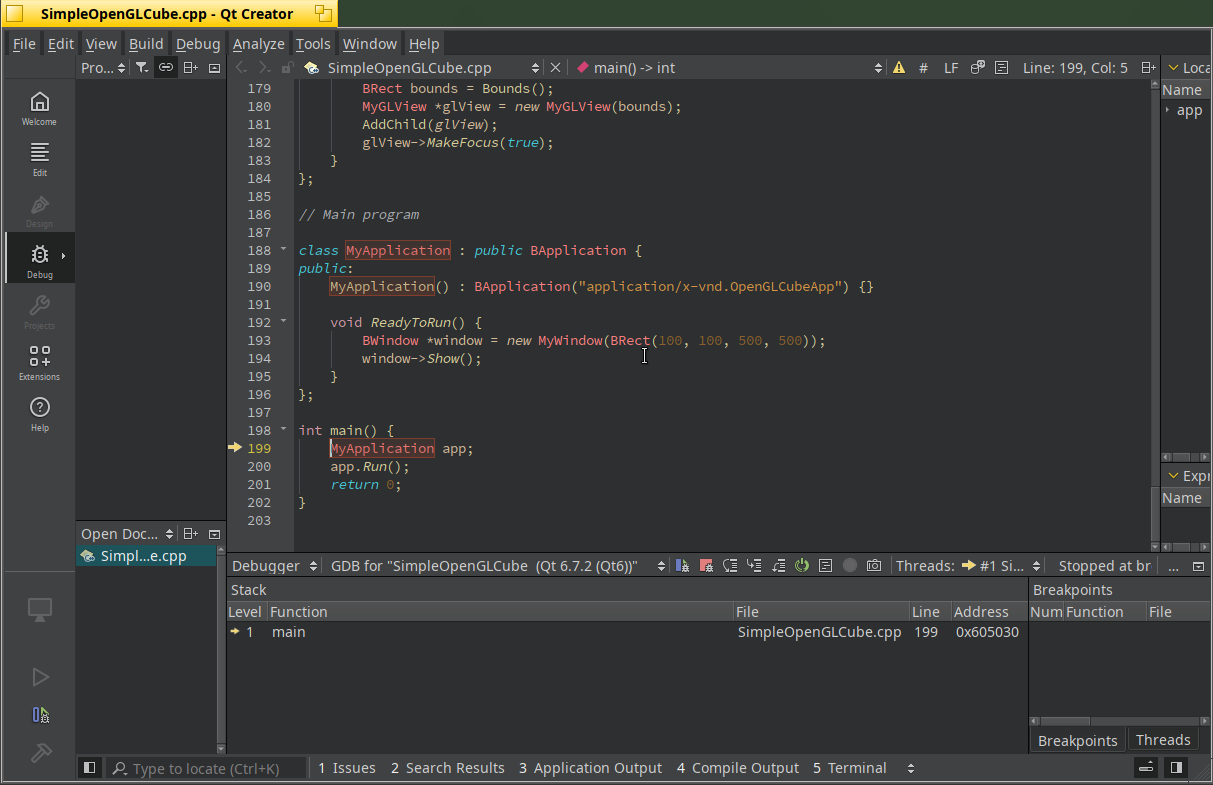
Click on the "Continue" icon to make the program continue to run.
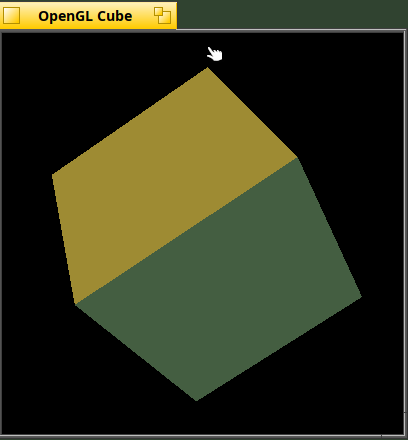
You should see a nice color cube rotating over time :)
Now click on the SwapBuffers() line to make a red dot appear :
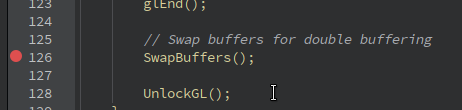
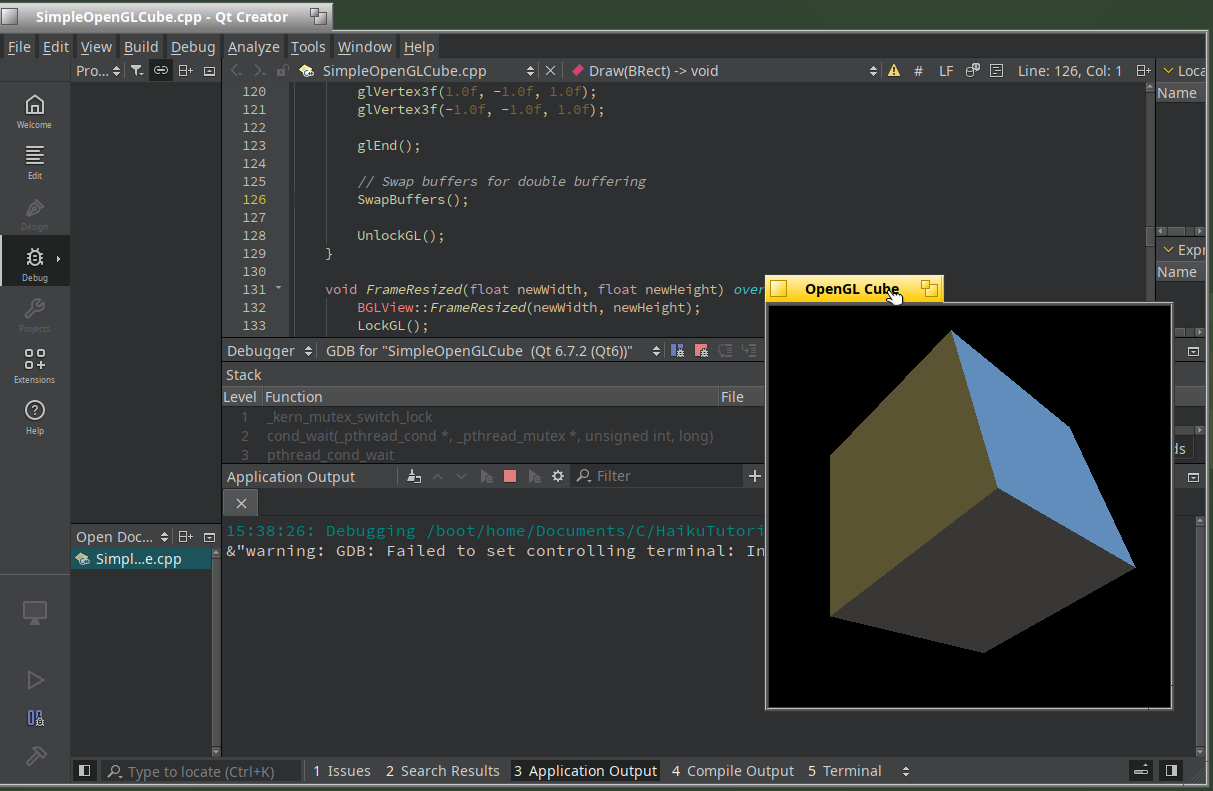
You should notice the cube is not rotating anymore and that the program is waiting for your response :
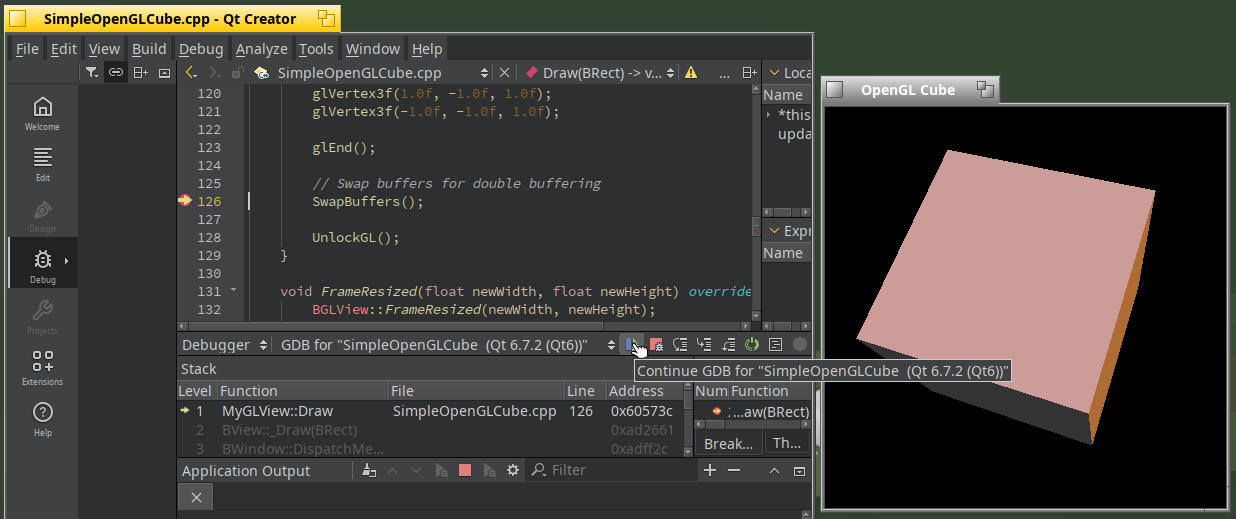
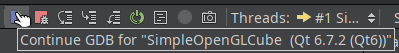
Click on "Continue" icon again, the program should stop again at the same break point defined before :
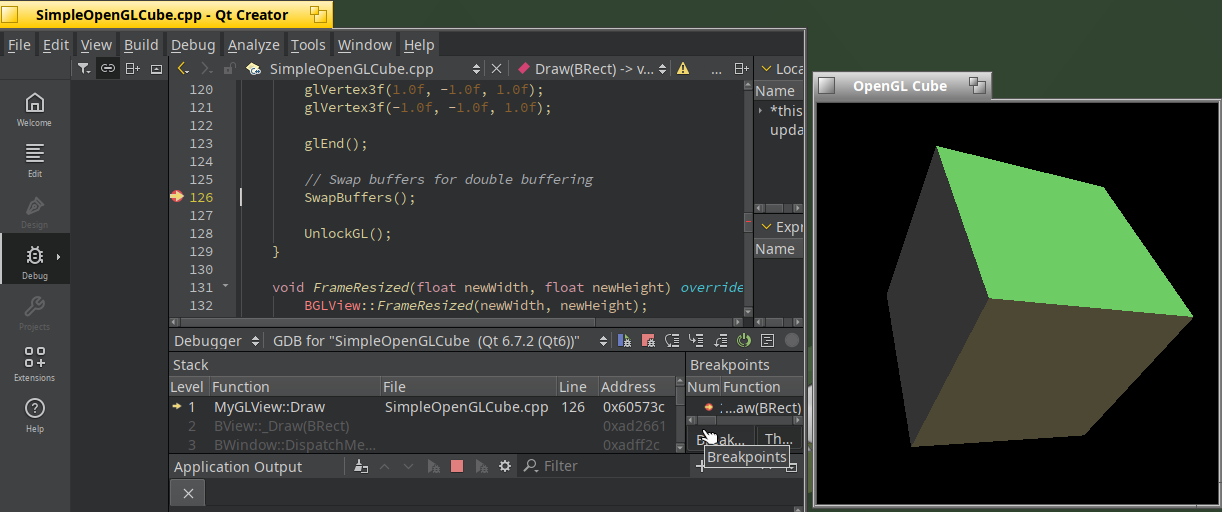
GDB propose also to "Step over" or "Step into" your instructions :
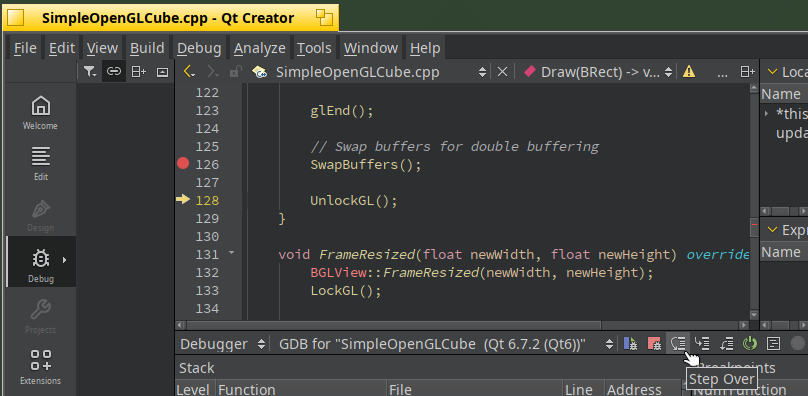
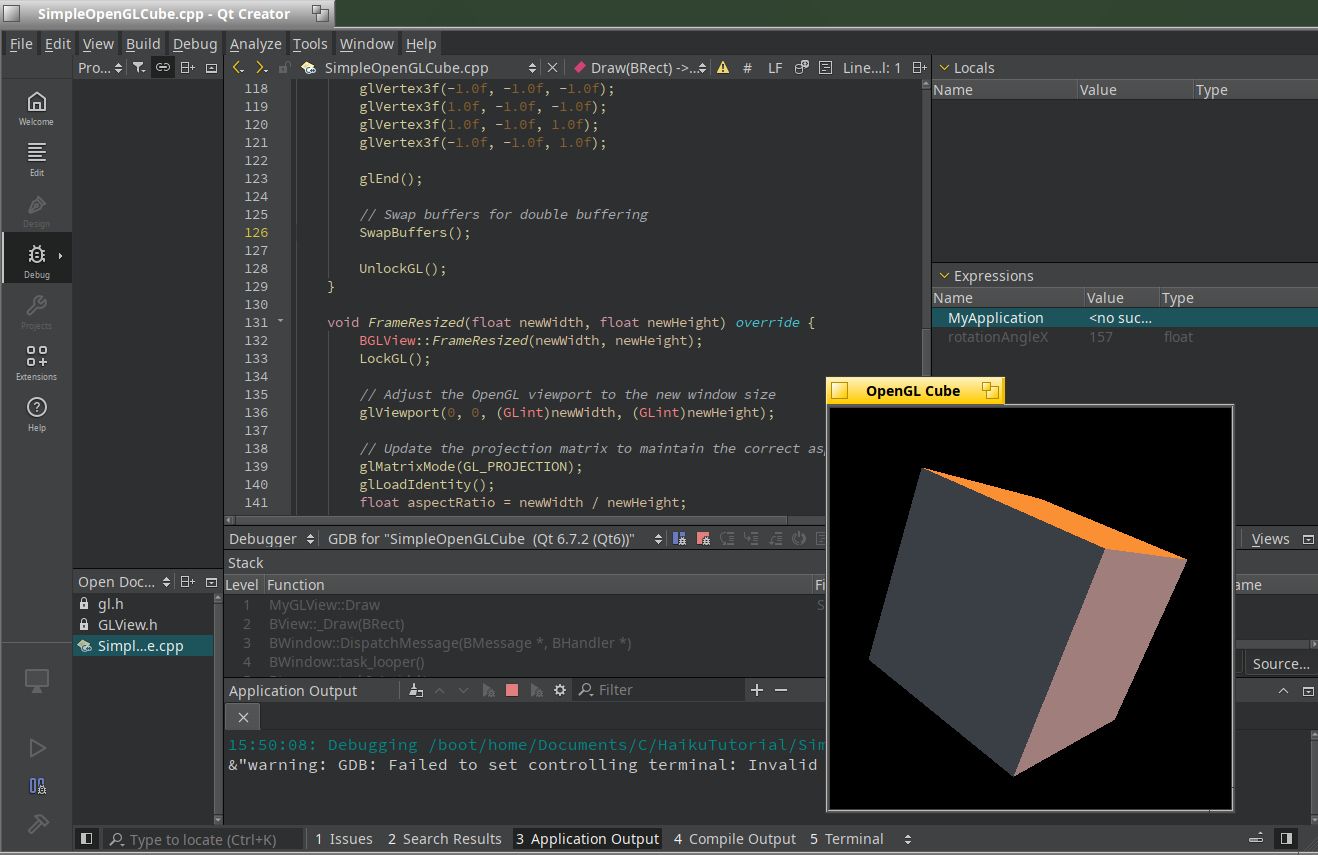
As you can see, the yellow arrow indicates the current line which is running.
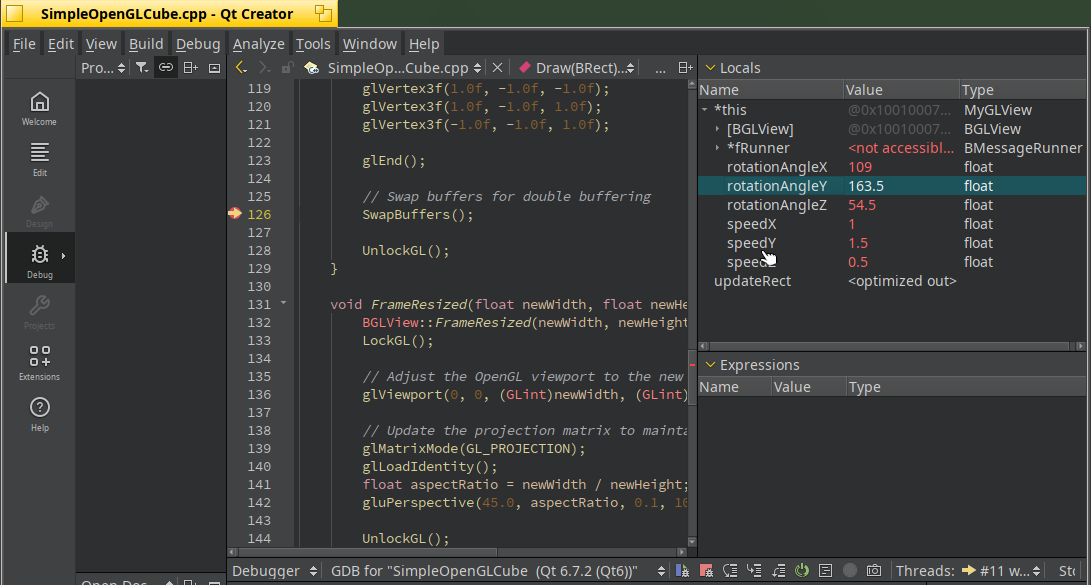
Another nice feature is also the ability to display the current variables available. Below are the rotation variables but also the speed variables of the cube displayed on the right of the screen :
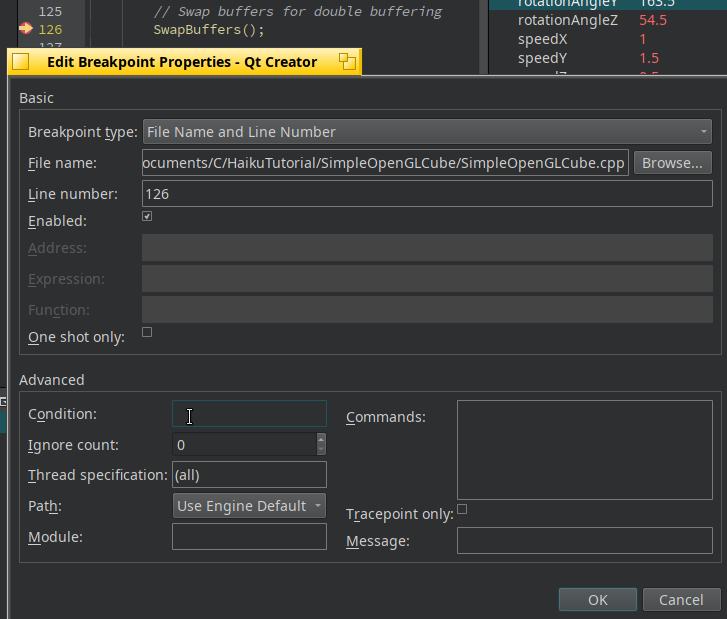
For advanced debugging session, you can also edit a breakpoint and incidate in the "Advanced" section a "Condition" indicating when the breakpoint must be activated (it can depends for example on the specific value of a variable) :
Another feature is the hability to view the stack of the functions calls.
Below the MyGLView is called by BView:Draw() :
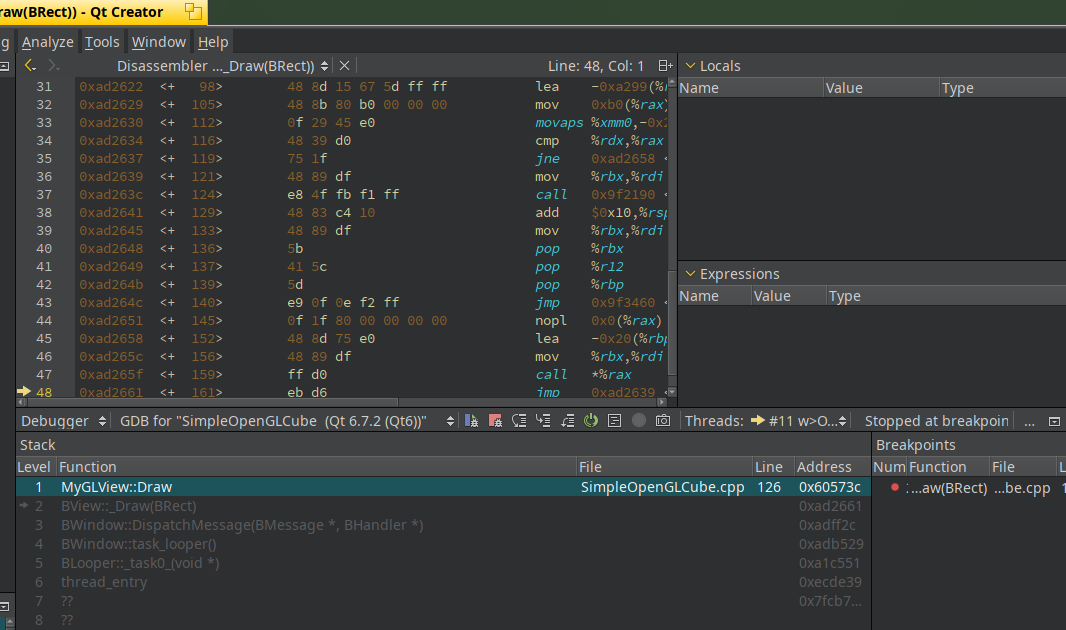
If you see dissasembler insctructions instead of the C/C++ source code, it's because at this level (the Haiku OpenGL API), the source code is not available.
If the OpenGL library was compiled in debug mode, I guess the source code should be displayed too (I didn't test it though).
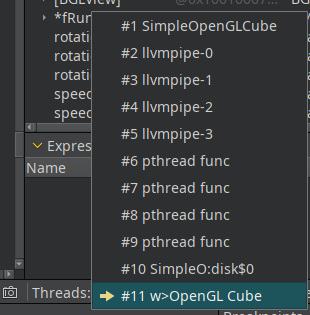
You can also check in which thread you are. Below the "w>OpenGL Cube" thread is where the breakpoint was applied :
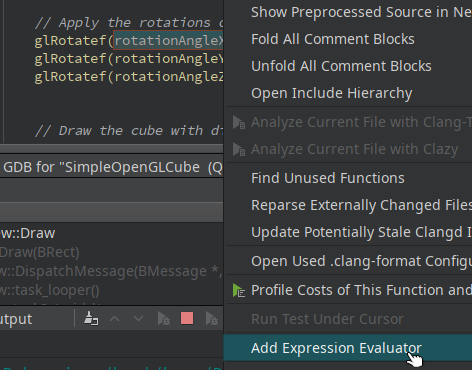
Finally, you can also add some watch variables via the menu "Add Expression Evaluator" :
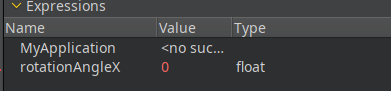
In my case the rotationAngleX variable was added in the Expressions list because I consider it as important for my debugging :
Conclusion
I hope you find this article helpful regarding the debugging land on Haiku.
Let know in the comments section below, how do you debug today your program in Haiku and if QtCreator/GDB is a great alternative to the current built-in debugger :)